
ESG Charts.
Environment, Social and Governance (ESG) has become increasingly important in recent years. ESG is about the ability to create and maintain long-term value in a rapidly changing world. ESG-centric companies have greater sensitivity to navigate and adapt to market and non-market changes.
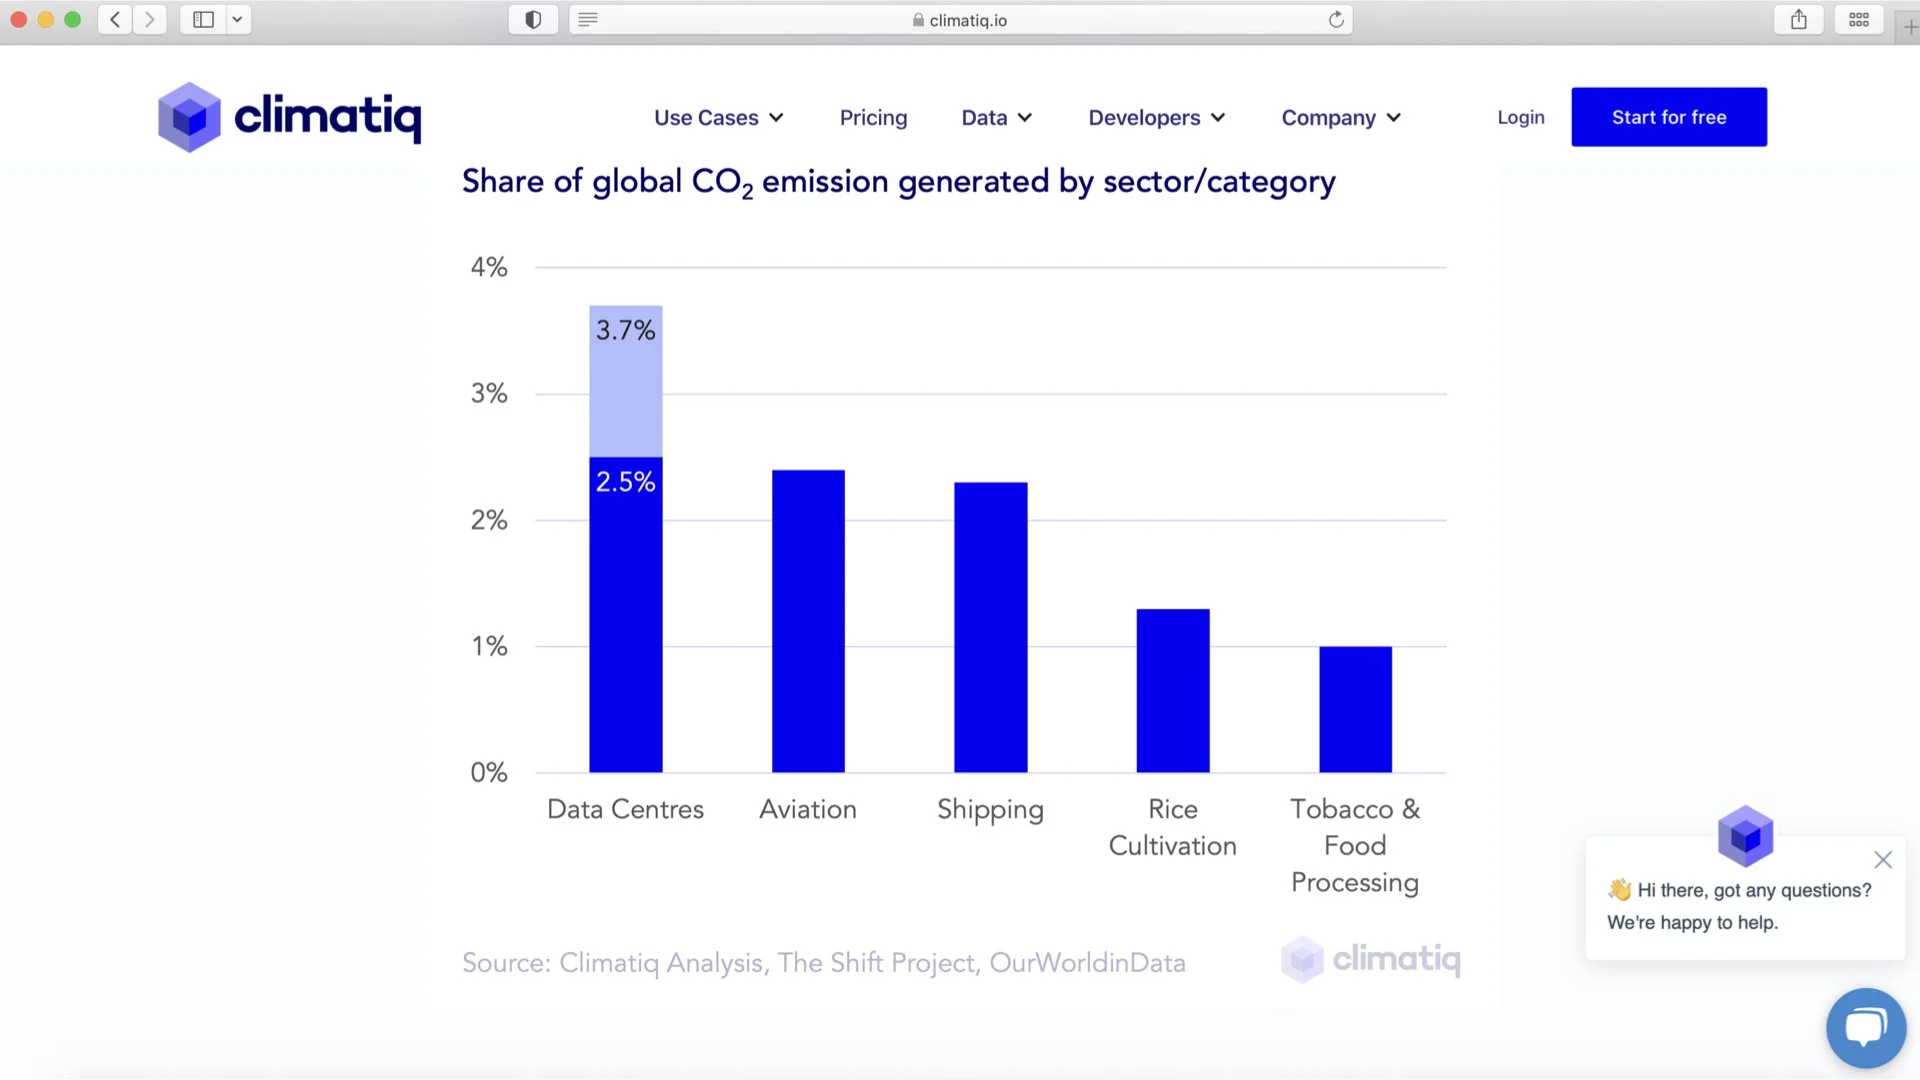
Share of global CO2 emissions.
Internet generates about 3.7% of global greenhouse emissions such as:
0.3 g CO2 per spam.
50 g CO2 per email with attachment.
43 kg CO2 one hour video conference.
The number of digital devices will increase by 50% and the digital footprint will double or triple by 2025.
Source: https://www.goclimate.com/blog/the-carbon-footprint-of-servers/
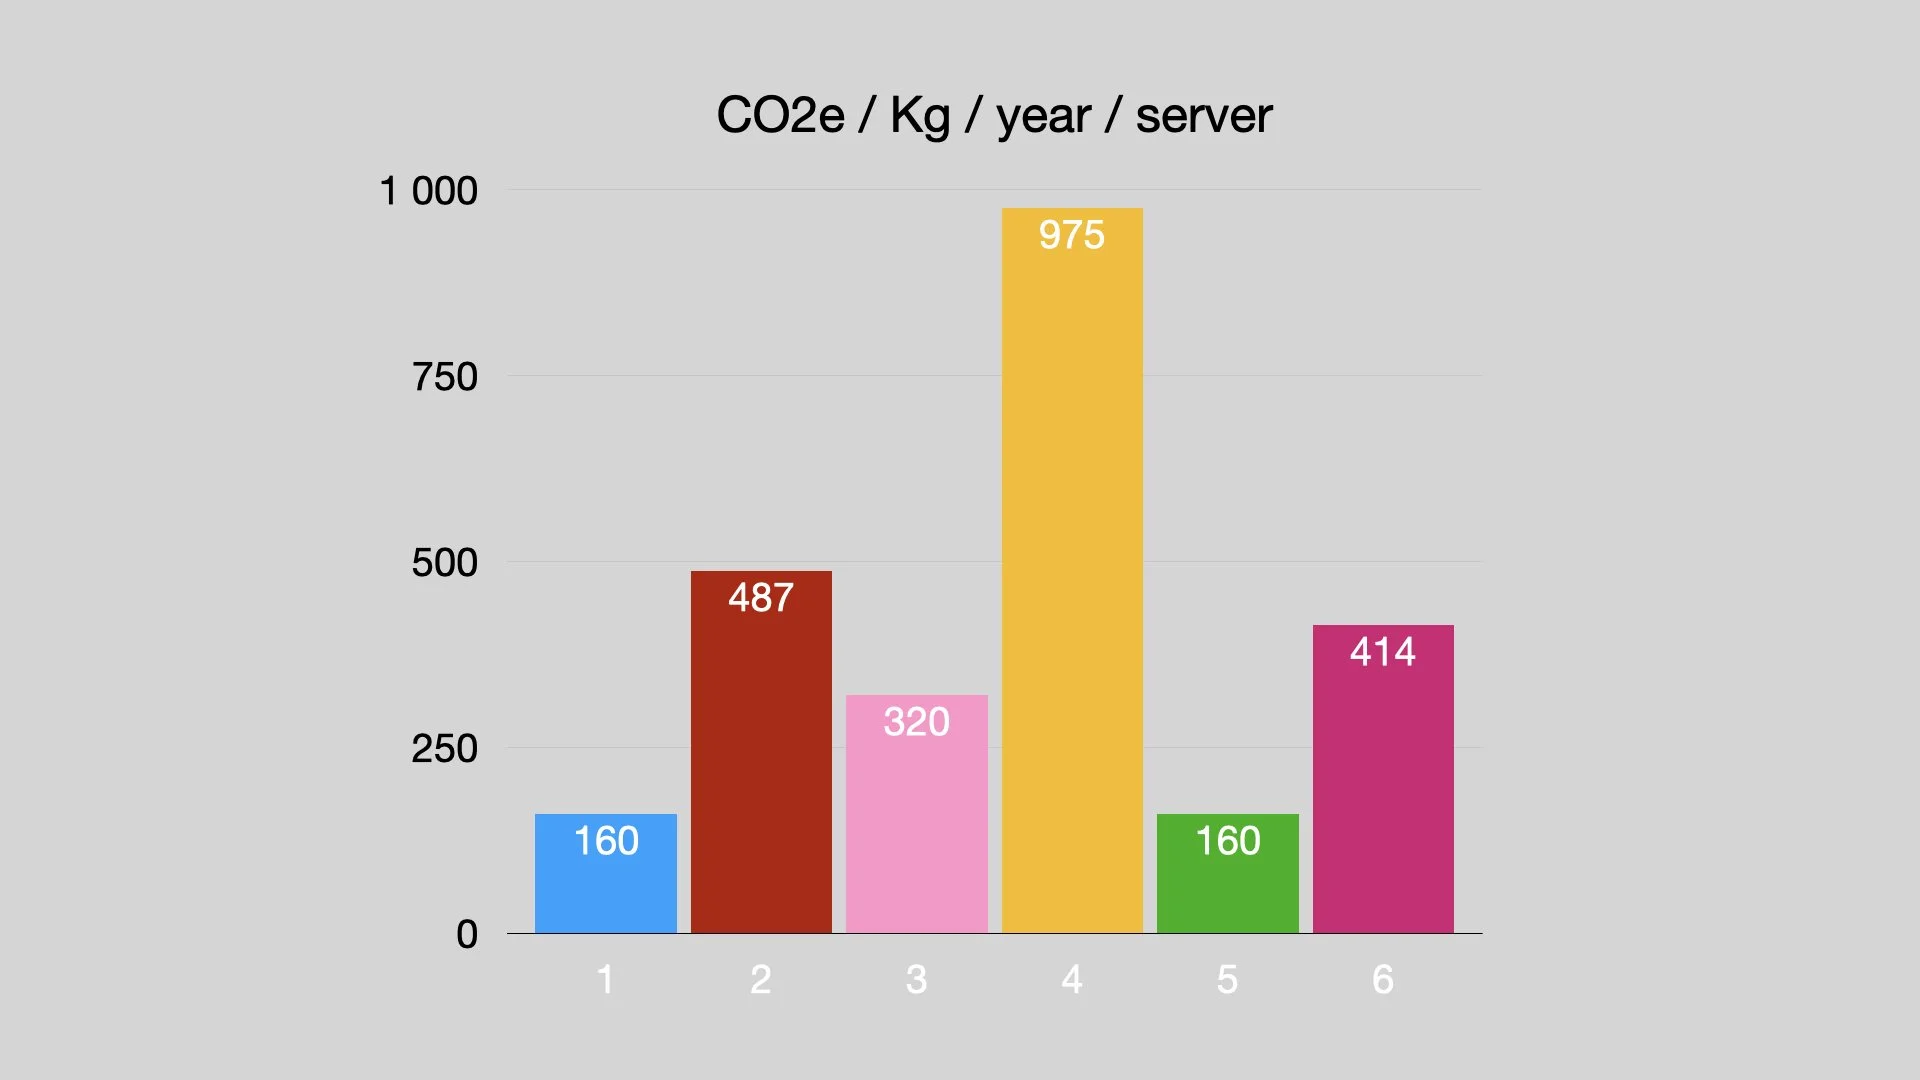
Examples of servers used in data centers.
1. Cloud server using 100% green electricity: 160 kg CO2e / year and server
2. Cloud server using non-green electricity: 487 kg CO2e / year and server
3. On premise or data center-server using 100% green electricity: 320 kg CO2e / year and server
4. On premise or data center-server using non-green electricity: 975 kg CO2e / year and server
5. T.2 server using green electricity:
6. T.2 server using non green electricity
The amount of CPU, network, memory and storage used by your services and the utilization rate of machines in your data centers as well as the efficiency with which your data centers are cooled and the use of electricity, usually specified as Power Usage Effectiveness or PUE.
Server example: (Dell PowerEdge R640) consumption is based on 1760.3 kWh/year.
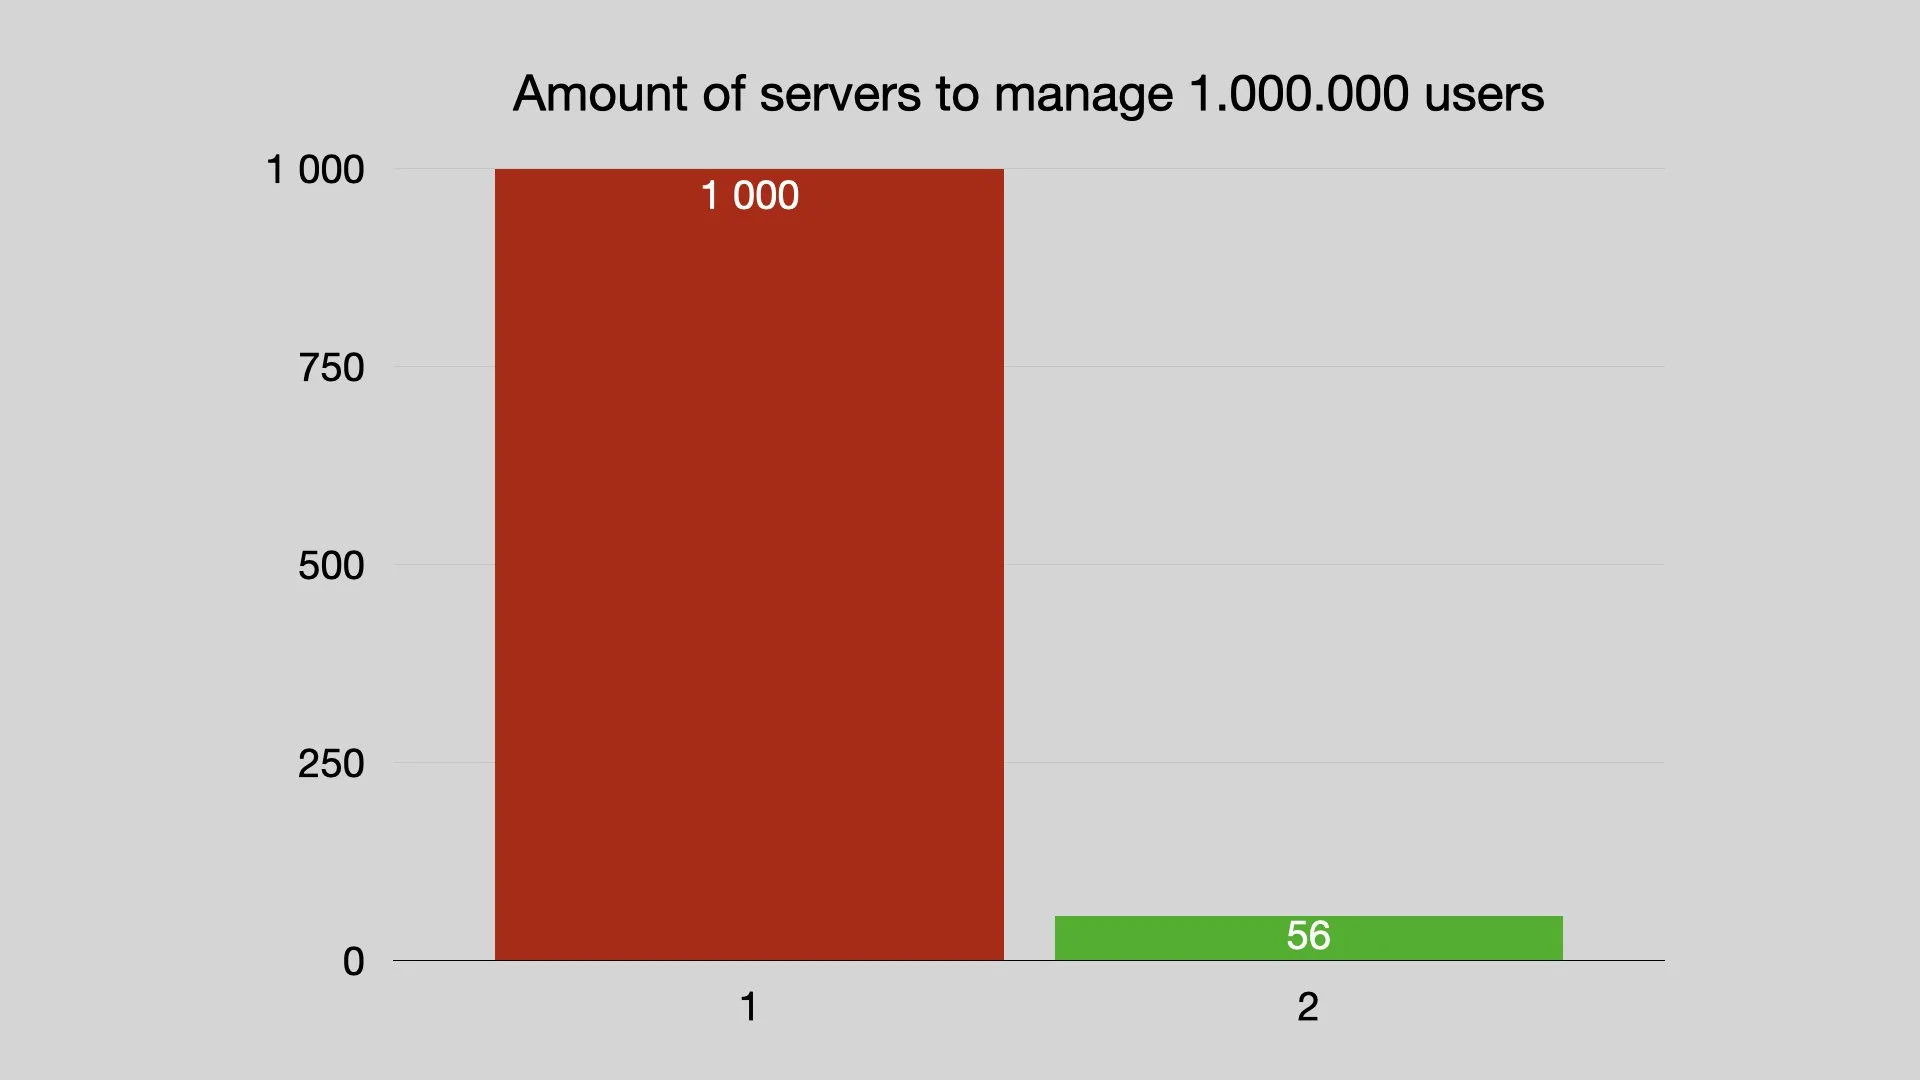
Examples of server benefits with the T.2 system.
1. Streaming/Video
2. T.2 Creating movements with sound
Cloud server example: Red5 Pro can be scaled in small steps: Capacity of 300-1000 users.
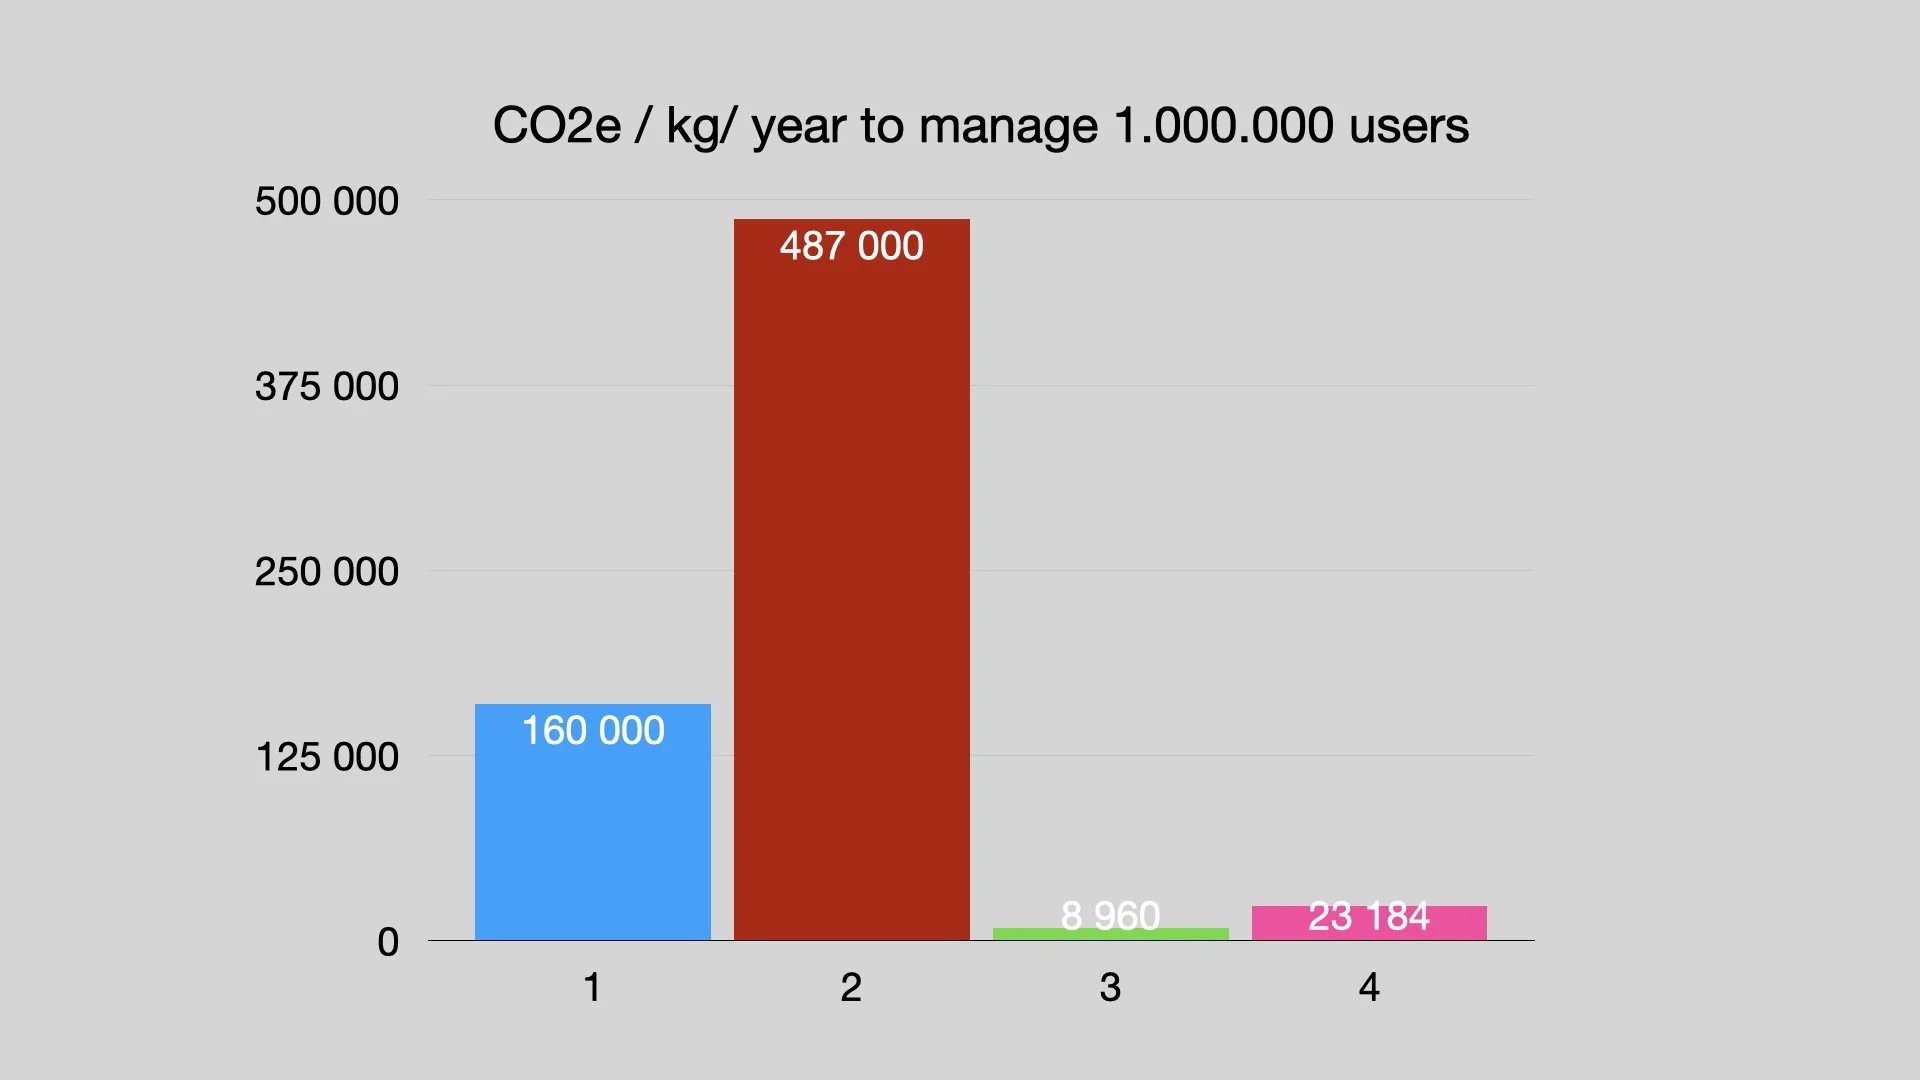
Example of CO2e benefits with the T.2 system.
1. Cloud server using 100% green electricity: 160 kg CO2e / year and server
2. Streaming/Video (Cloud server using non-green electricity: 487 kg CO2e / year and server)
3. T.2 Creating movements with sound with green electricity
4. T.2 Creating movements with sound without green electricity
Comparison with green energy
94.5% less CO2 "footprint."
Comparison with non-green energy
95.24% less CO2 "footprint."
Comparison of green energy cloud server with non-green energy T.2 server
86% less CO2 footprint.”
Example of latency benefits with the T.2 system.
1. Streaming/Video
2. T.2 Creating movements with sound
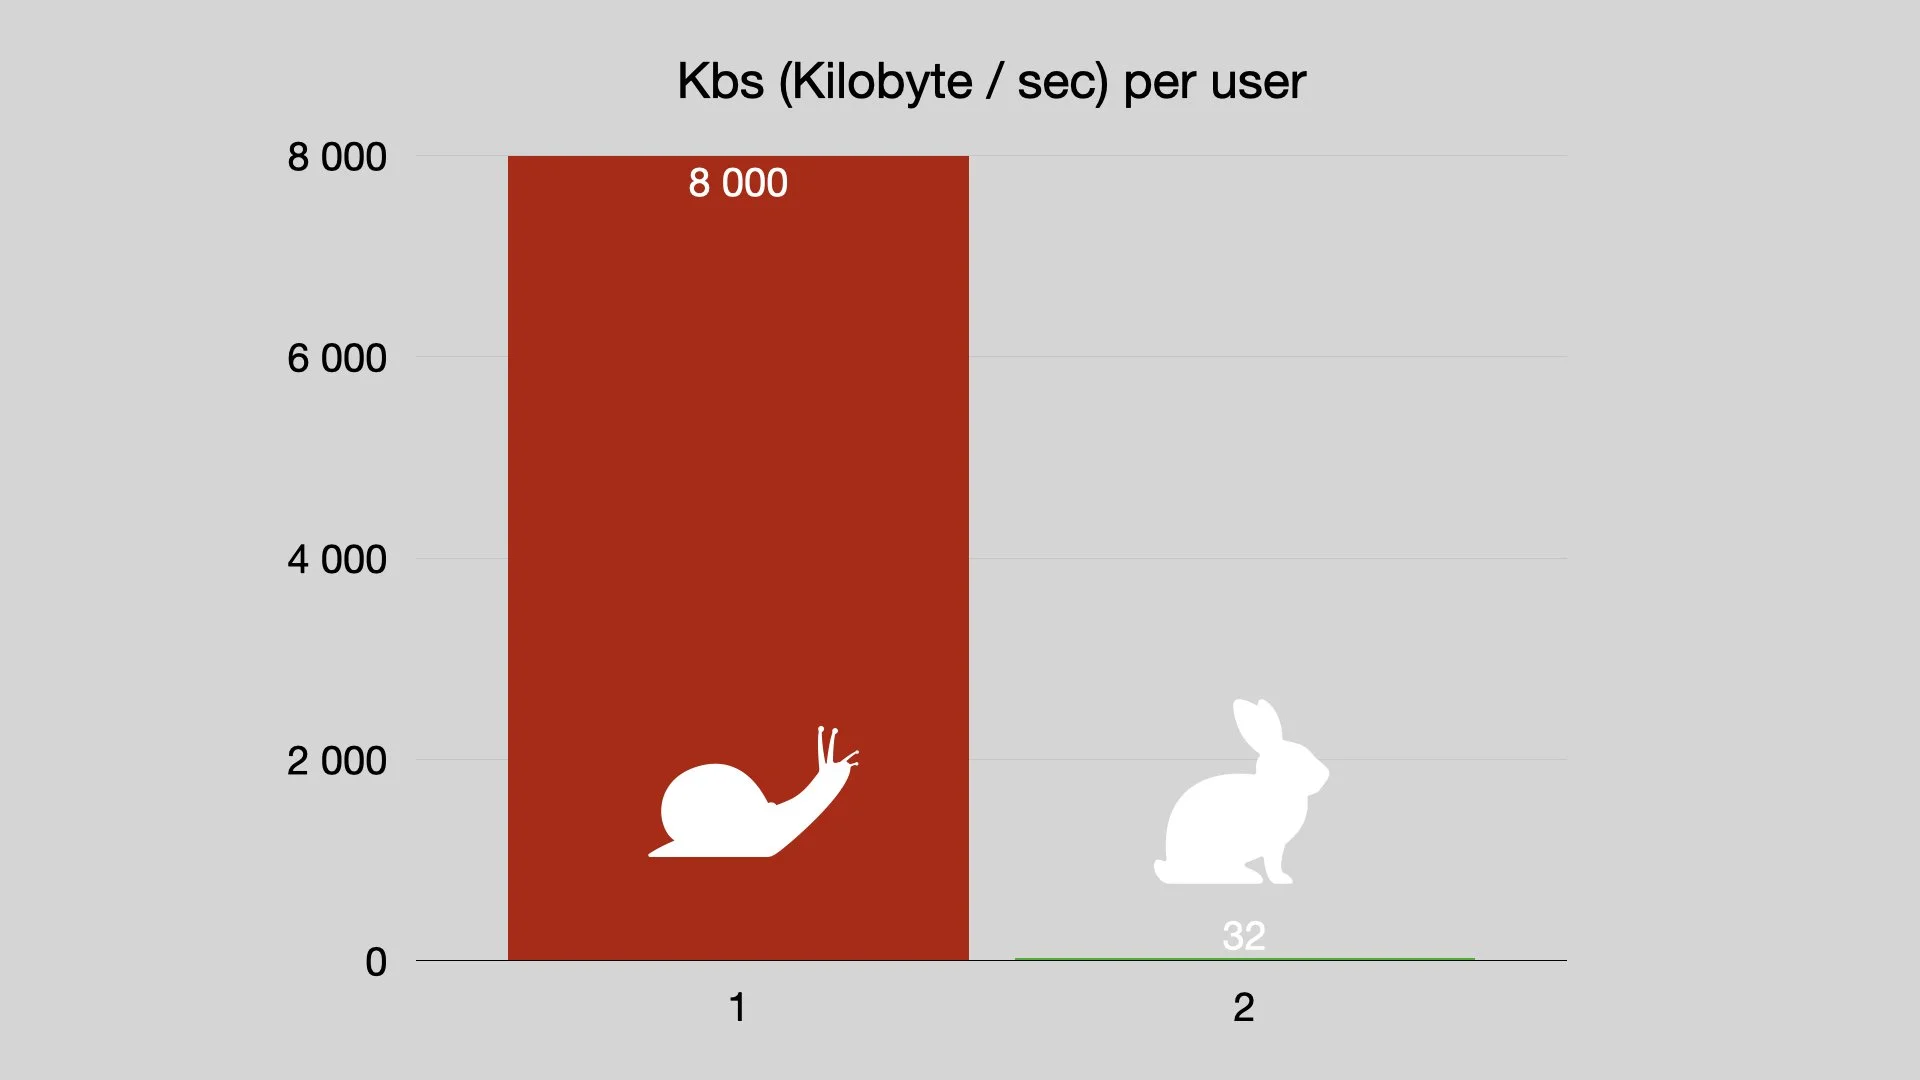
T2 was uniquely built to overcome all current bottlenecks in the transmission of large data; speed, storage, bandwidth, etc. With T2, data no longer needs to be transferred. It remains in each user's location. Exception made for audio files. High-quality audio files are transferred without latency because audio data is over 99.6% lighter than images. (8000kbs video vs 32kbs audio.)
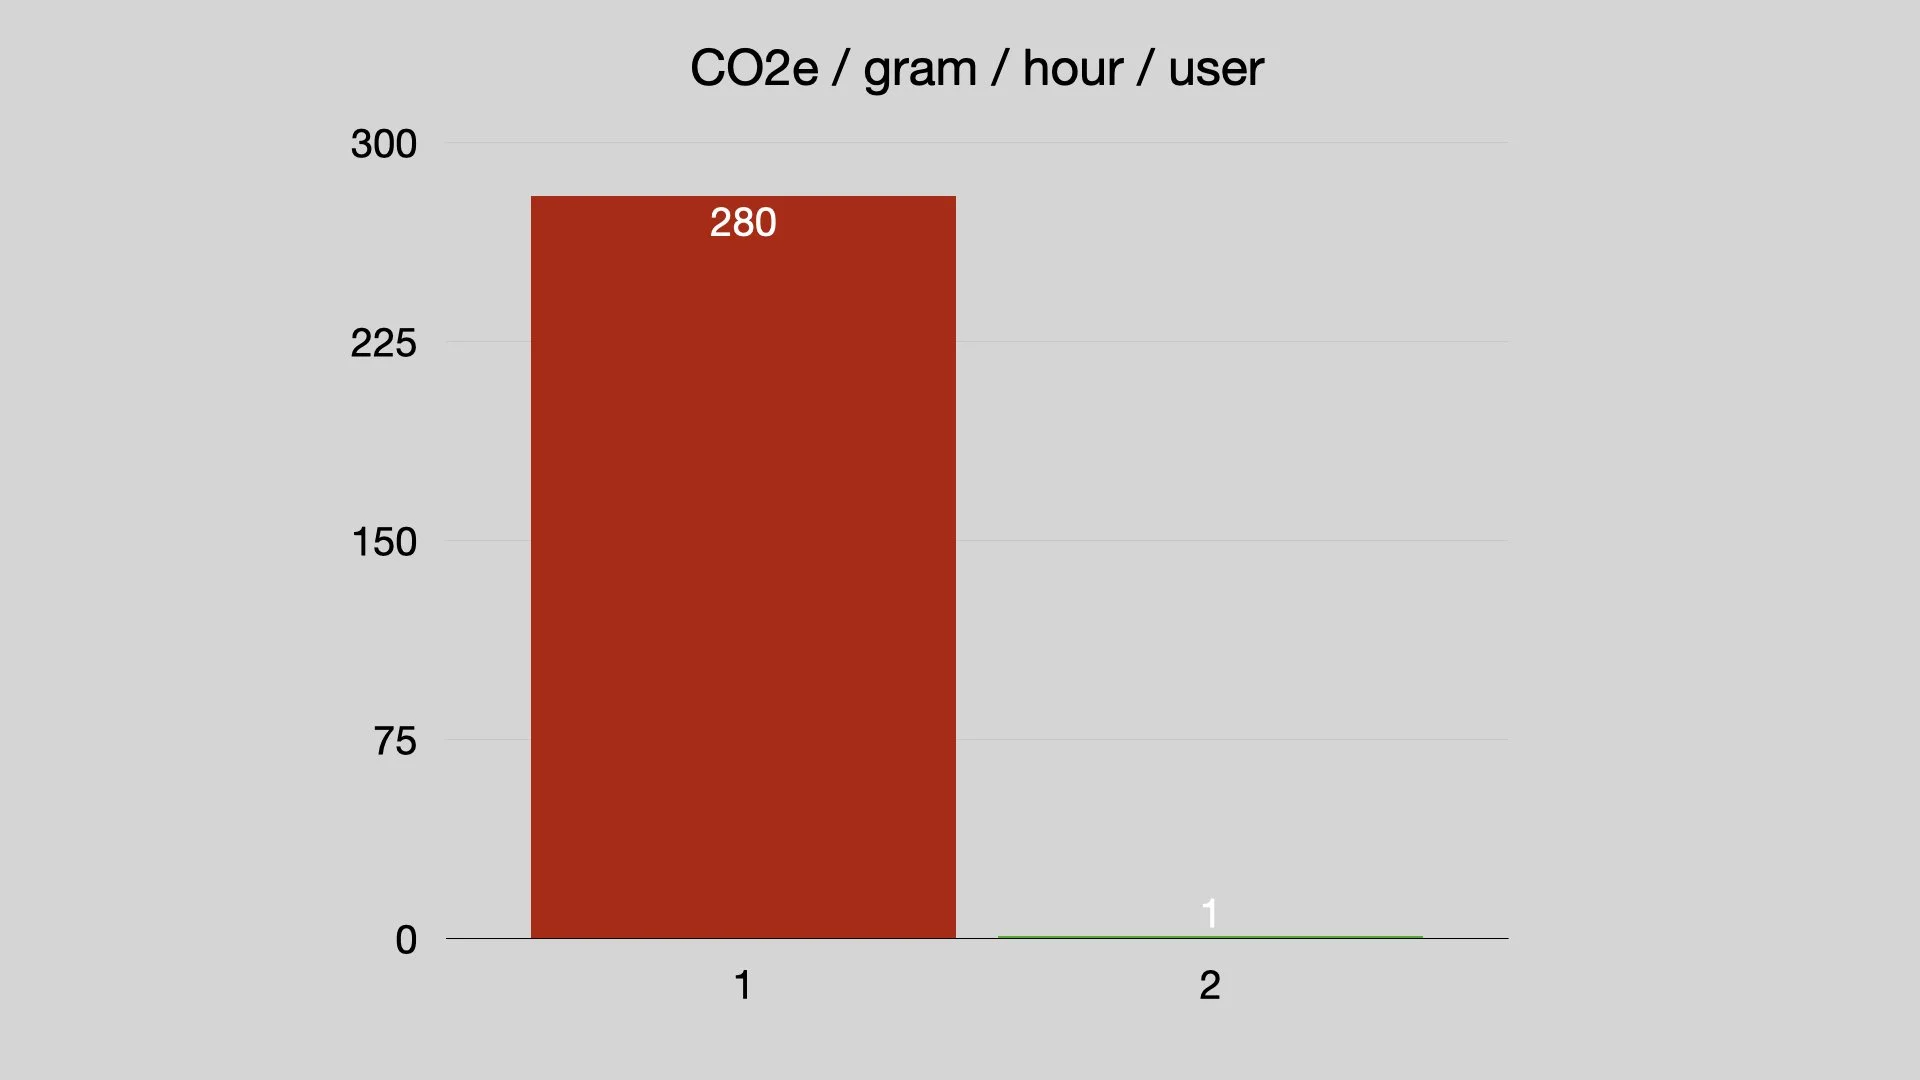
Example of CO2 benefits per user with the T.2 system.
1. Streaming/Video
2. T.2 Creating movements with sound.
Estimated kWh per GB It has been estimated that the kWh per GB is 0.015.
This means that the amount of CO2 emissions per kWh is approximately 0.28 kg.
One hour of streaming = 1 GB